Crystallography is when a football stadium-sized synchrotron is used to measure distances on the order of several angstroms (the length of the peptide bond between amino acids $ 1.3~\mbox {\normalfont \AA} $).
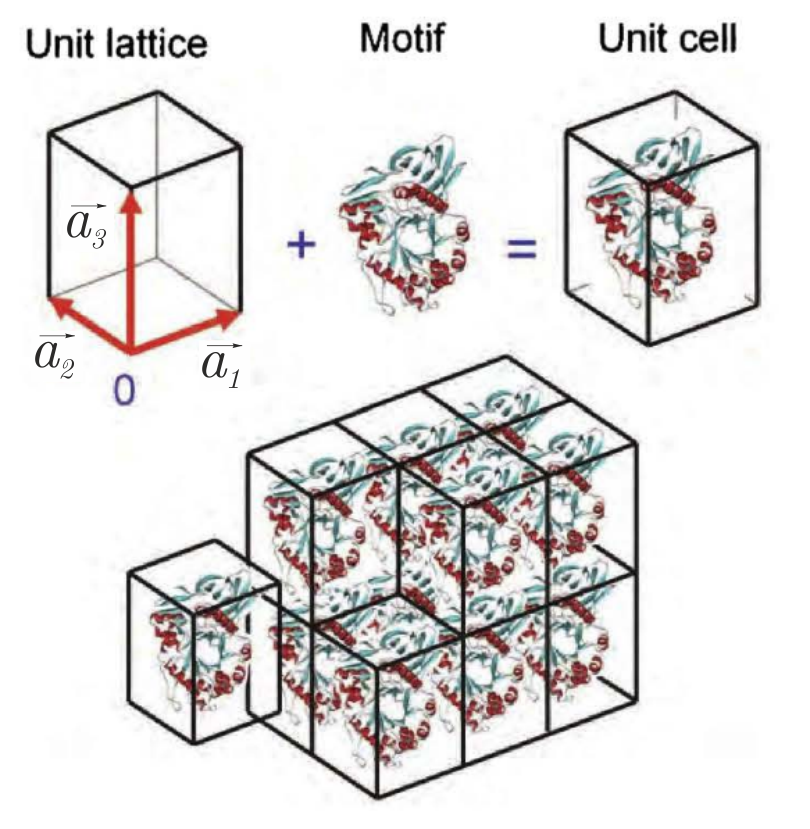
The main object studied in crystallography is a crystal. It can be thought of as one periodically repeating element in space - a unit cell. (Fig. 1)
If $ \rho (\vec{x}) $ is some real function that describes the structure of the unit cell (for example, the positions of atoms or the density of electrons) and $\vec{a_1}, \vec{a_2}, \vec{a_3}$ – lattice vectors (may not be perpendicular to each other), then a complete crystal can be generated using the following equation:
$$\rho(\vec{x} + e \cdot \vec{a_1} + f \cdot \vec{a_2} + g \cdot \vec{a_3} )= \rho(\vec{x}), \qquad e, f, g, \in \mathbb{Z}.$$
In the case of 1D or 2D crystals, one ($\vec{a_1}$) or two vectors ($\vec {a_1}$ and $\vec{a_2}$), respectively, is sufficient to create a crystal from a unit cell.
The main task of the crystallographic experiment is to determine the crystal structure (in particular, $\rho (\vec{x}), \vec{a_1}, \vec{a_2}, \vec{a_3} $).
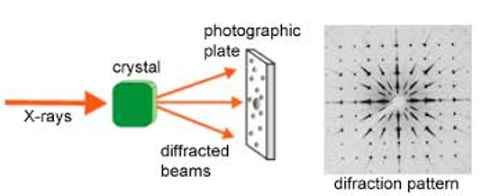
Due to the periodicity of the crystal, one method that can be used to determine the structure is radiation diffraction.
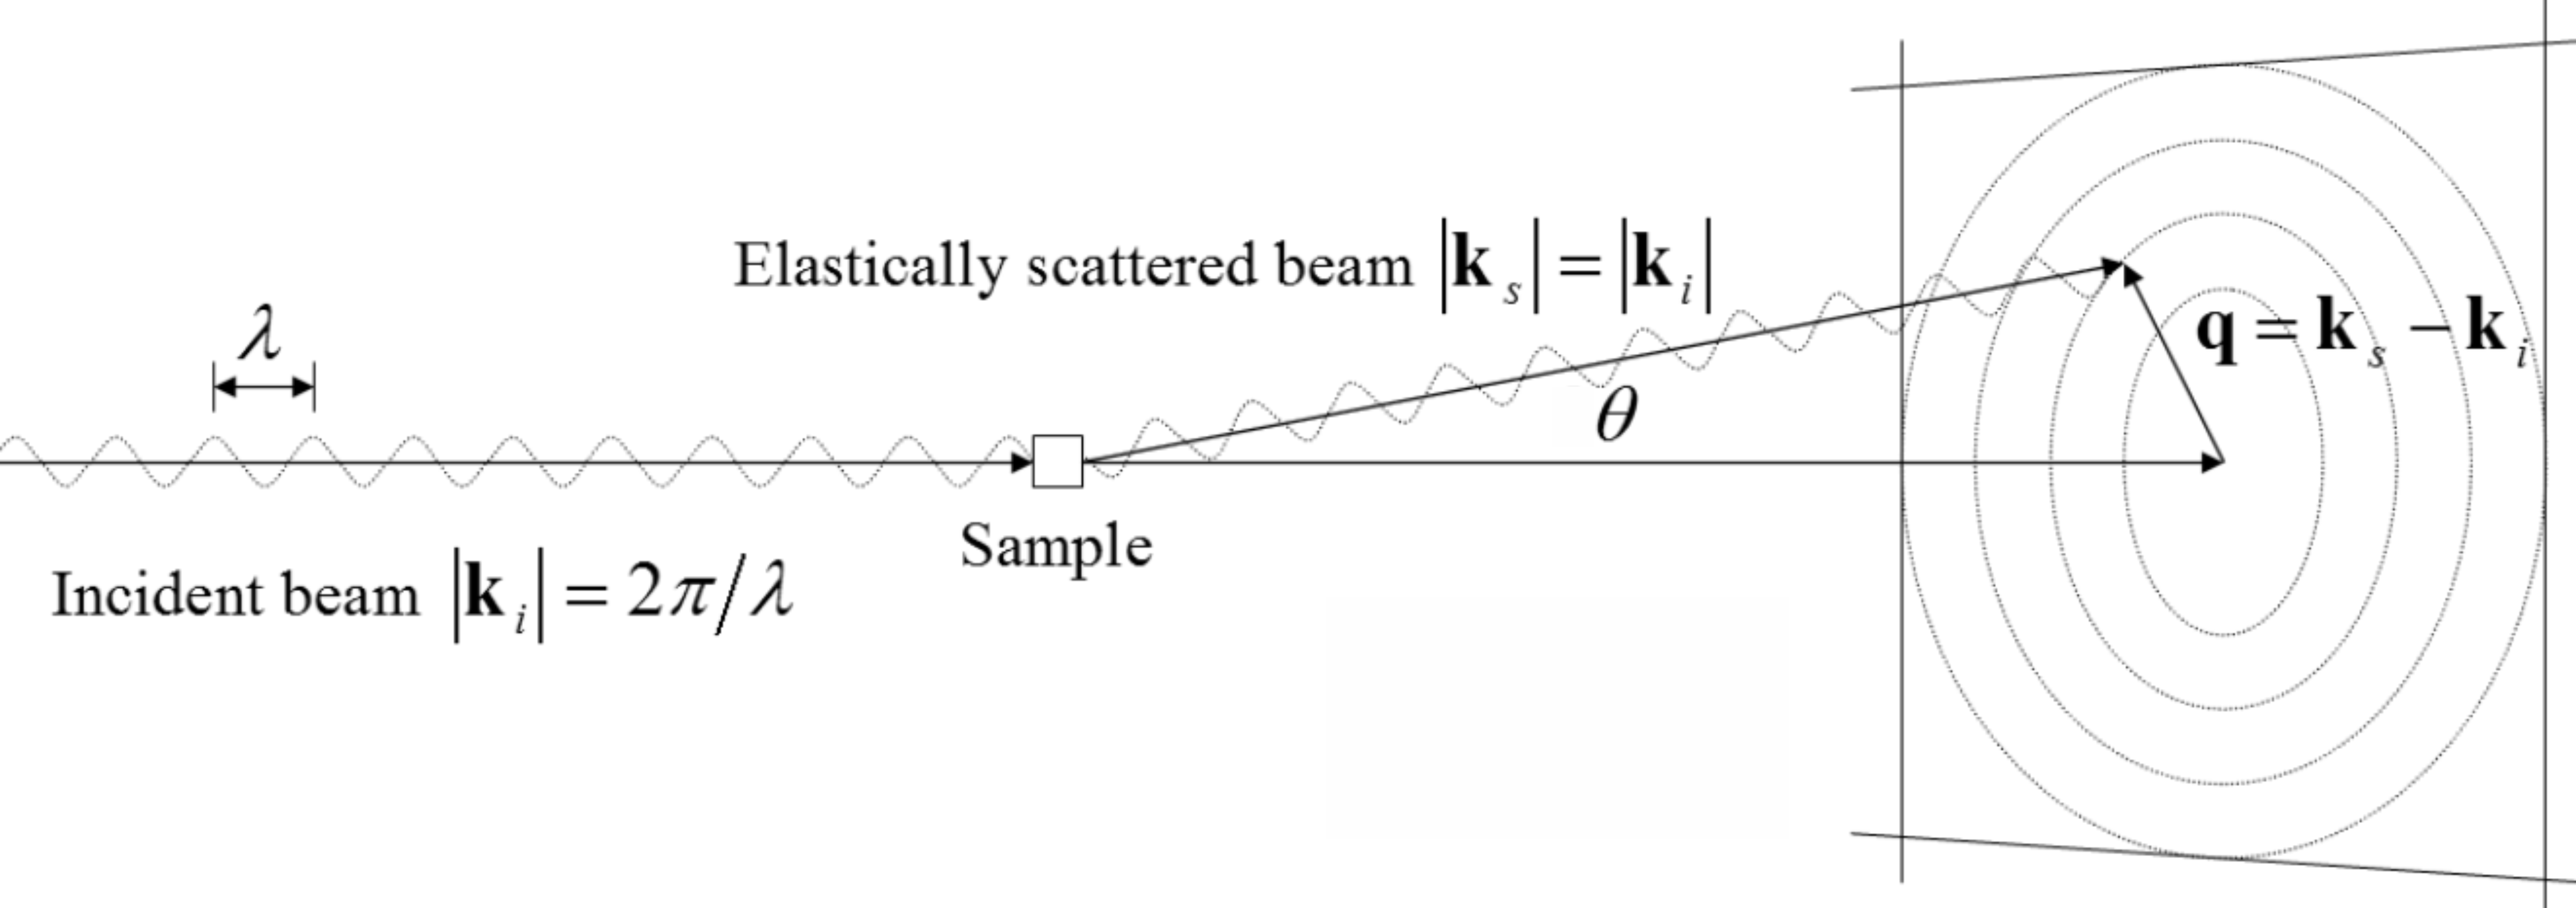
In the crystallographic experiment (Fig. 2), an incident beam with intensity $I_0$, wavelength $\lambda$ and wave vector $\vec{k}_i$, ($| \vec{k_i}| = 2 \pi / \lambda$) passes through the crystal (in the case of a 2D crystal $\vec{k_i}$, it is perpendicular to the crystal plane). The diffracted beam has the same wavelength $\lambda$, wave vector $\vec{k}_s$, $|\vec{k}_s|=|\vec{k}_i|$ and can be denoted by the scattering vector $ \vec {q} = \vec {k} _s- \vec {k} _i $ (Fig. 3). It is clear that $q = 2 k_i \sin (\theta/2)$. The angle $\theta$ between $ \vec {k} _s $ и $ \vec {k} _i $ can be considered much less than one, that is, $q << k_i$.
The complex amplitude $F(\vec{q})$ of the diffracted ray $\vec{q}$ is called the structure factor (since it is determined by the crystal structure) and is denoted $ F (\vec {q}) $. It has a module $ | F | $ and $ \varphi $ phase:
$$F(\vec{q}) = |F| \cdot \exp(i \varphi ).$$
The measured intensity $I(\vec{q})$ is the square of the modulus of the complex amplitude:
$$I = |F|^2 = FF^*.$$
Further processing of these intensities gives the densites $ \rho (\vec {x}) $.
Usually the crystals under investigation contain small inorganic (salts or complex compounds) or even large organic molecules (proteins or DNA), and the density $\rho (\vec {x})$ determines the atomic positions of the compound. In this case, coherent X-rays with a wavelength of $ 1 \div 10 $ \AA (for example, synchrotron radiation) are used, corresponding to typical distances between atoms. If the distances are greater, a different wavelength should be chosen (for example, visible light can be used for optical gratings).
Now you will try to become a crystallographer. In Part A, using the example of a diffraction grating (1D crystal), we will study the basic laws. In Parts B, C, D you will define the lattice parameters, unit cell symmetries and then the detailed structure.
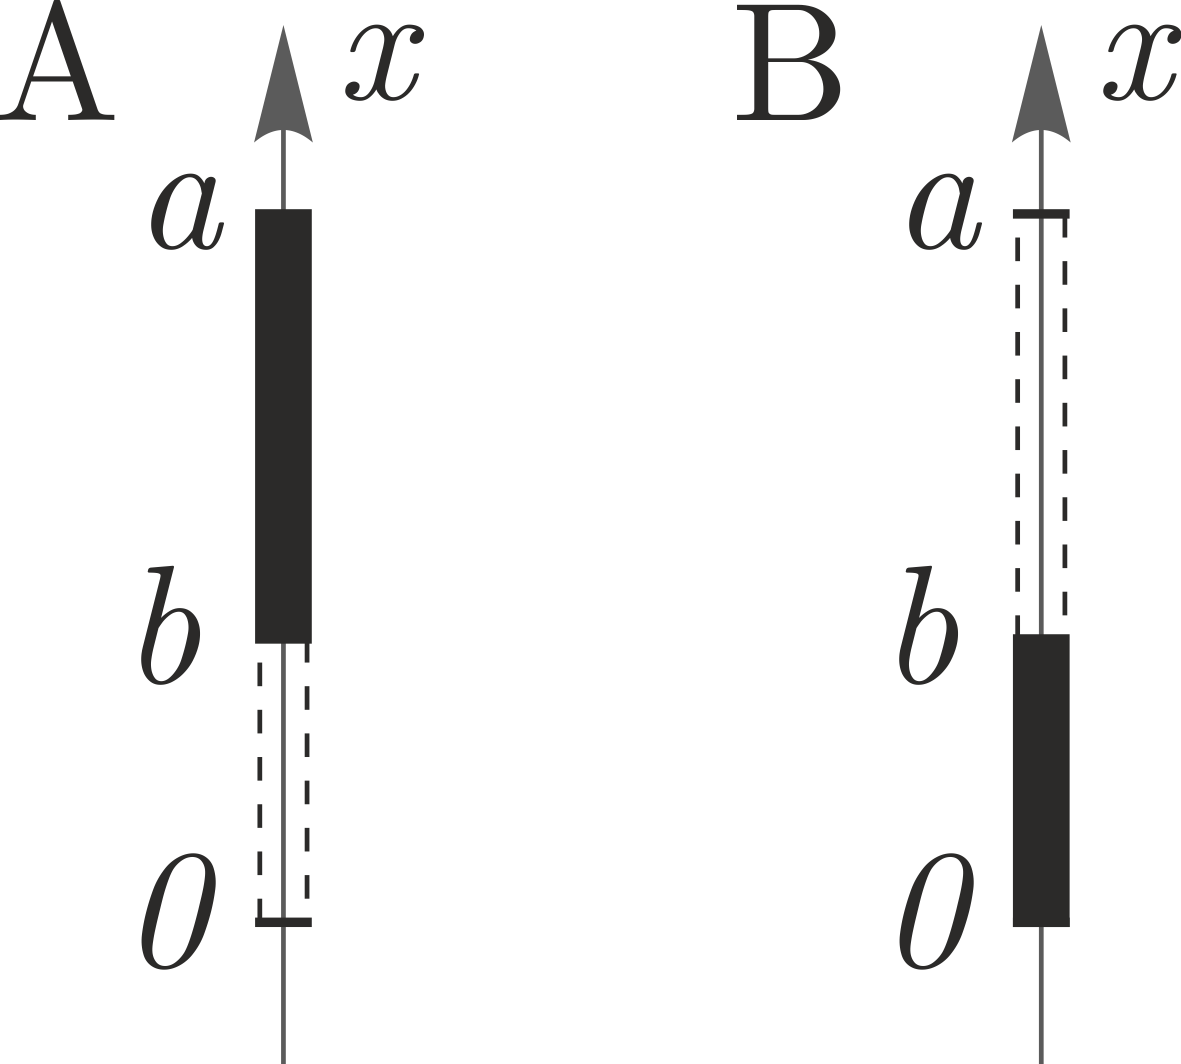
The simplest example of a crystal is an optical diffraction grating - it can be viewed as a one-dimensional crystal. Such a crystal has a slit (width $b$) and an inter-slit gap as a unit cell (Fig. 4A). The lattice period $a_1 = a$ is a one-dimensional vector that generates the crystal.
When observing Fraunhofer diffraction on a diffraction grating, the light intensity $I$ depends on the light propagation angle $\theta$ as follows
$$I(\theta) = \frac{I_0}{N^2} \left( \frac{\sin ( \frac{N \pi a \sin \theta}{\lambda})}{\sin ( \frac{\pi a \sin \theta}{\lambda})} \right)^2 \cdot \left( \frac{\sin ( \frac{\pi b \sin \theta }{\lambda})}{ ( \frac{\pi b \sin \theta }{\lambda})} \right)^2,$$
where $I_0$ is the intensity at $ \theta = 0 $, $ N $ is the number of illuminated slits of the diffraction grating.
To understand equation 1, you need to know that:
$$\lim_{x\to 0} \frac{\sin x}{x} = 1.$$
It can be noted that the period of the crystal $ a_1 = a $ is responsible for the periodicity of the diffraction maxima, and the unit cell parameters (slit width $ b $) are responsible for the intensity of the maxima. This fact is used to simplify the calculation of the relative intensities of the maxima by using the structure factor $ F (q) $:
$$F(q) \sim \int \rho(x) \exp (i q x) dx,$$
where $ \rho (x) $ – is transmission (the ratio of the amplitudes of the transmitted wave to the incident wave), $ q $ – the scattering vector, which describes the position in the diffraction pattern. Integration is carried out over the entire unit cell. If we replace $ q $ with the position of this or that maximum, it will be possible to find the relative intensities of the maxima as $ I = | F | ^ 2 $. Here and below $ \rho (x) \in \mathbb{R}. $
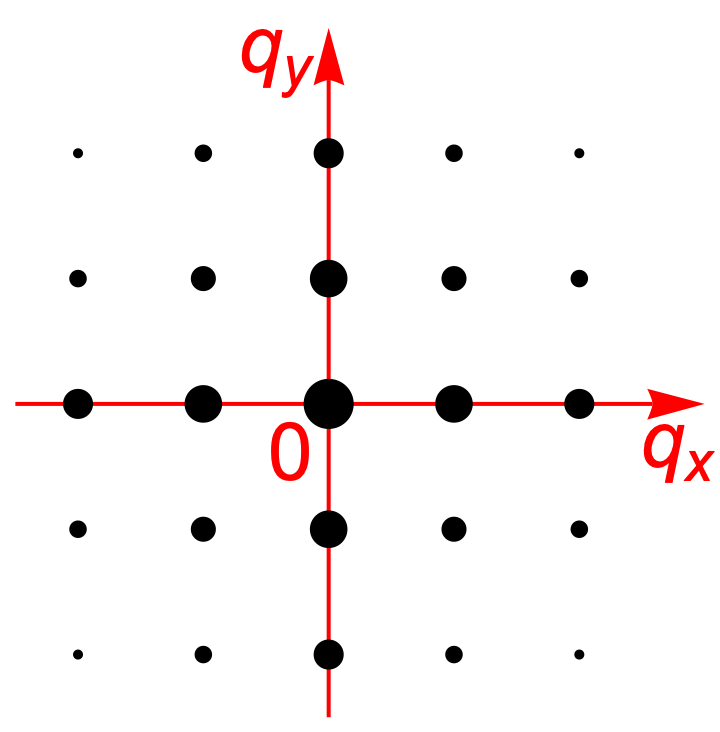
The positions of the intensity maxima for crystal diffraction (called reflexes) can always be represented as a sum of vectors (called reciprocal lattice vectors):
1-D: $ \vec {q} = h \cdot \vec {q} _1 $, where $ h \in \mathbb {Z} $;
2-D: $ \vec {q} = h \cdot \vec {q} _1 + k \cdot \vec {q} _2 $, where $ h, k \in \mathbb {Z} $;
3-D: $ \vec {q} = h \cdot \vec {q} _1 + k \cdot \vec {q} _2 + l \cdot \vec {q} _3 $, where $ h, k, l \in \mathbb {Z} $.
Thus, each reflex for a 3D crystal can be denoted by three numbers $ (h, k, l) $ (and $ (h) $ for 1D and $ (h, k) $ for 2D) and has its own complex amplitude $ F (h, k, l) $ and intensity $ I (h, k, l) $.
A6 0.70 Write down $ \rho (x) $ for the unit cell of the diffraction grating from A1 (Fig. 4A). Use the coordinate system as shown in the figure. Suppose that the unit cell is such that the period of the lattice $ a $ is $ p $ times the width of the slit $ b $: $ a = p b, \quad p \in \mathbb{N} $. Calculate the structure factor $ F_A (h) $ for this unit cell for reflex $ h $. Record your answer using $ h $ and $ q_1 $. What maxima have intensity 0? Write the equation for $ h $ for such maxima.
In this part you will go through the first step in defining the structure – finding the lattice parameters.
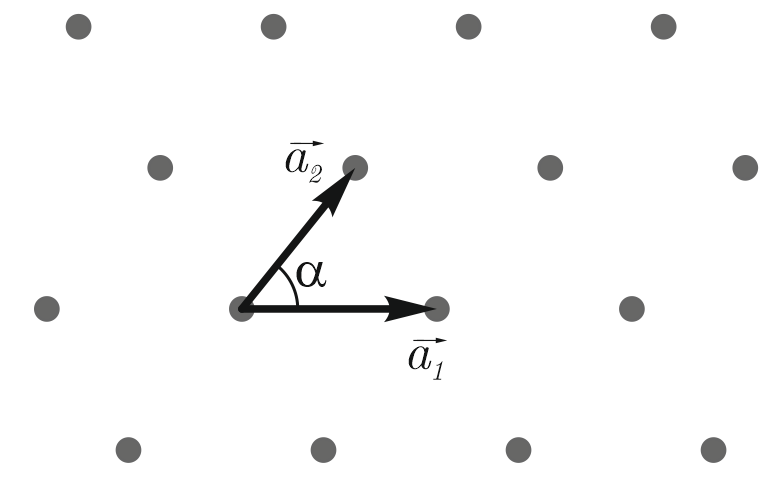
Let us consider diffraction on a two-dimensional crystal. A schematic 2D crystal of point atoms is shown in Fig. 5. Lattice vectors $ \vec{a_1} $ and $ \vec{a_2} $ has an angle $ \alpha \le 90 ^ \circ $ between them.
If the plane of a given 2D crystal is placed perpendicular to the beam, then a periodic diffraction pattern appears on the screen behind the crystal, the position of the maxima of which is described by the expression $ \vec {q} = h \cdot \vec{q}_1 + k \cdot \vec{q}_2 $, where $ h, k \in \mathbb{Z} $.
You can get an idea of such a diffraction pattern by looking at the diffraction patterns of UC1-UC7 samples.
B1 1.00 Find the angle $ \beta $ between the vectors $ \vec{q}_1 $ and $ \vec{q}_2 $ and their lengths $ q_1 $, $ q_2 $. Please note that these vectors must be of minimum length and the angle between them must be $ \le 90 ^ \circ $. Express your answer through the crystal parameters $ a_1, a_2, \alpha $ (Fig. 5)
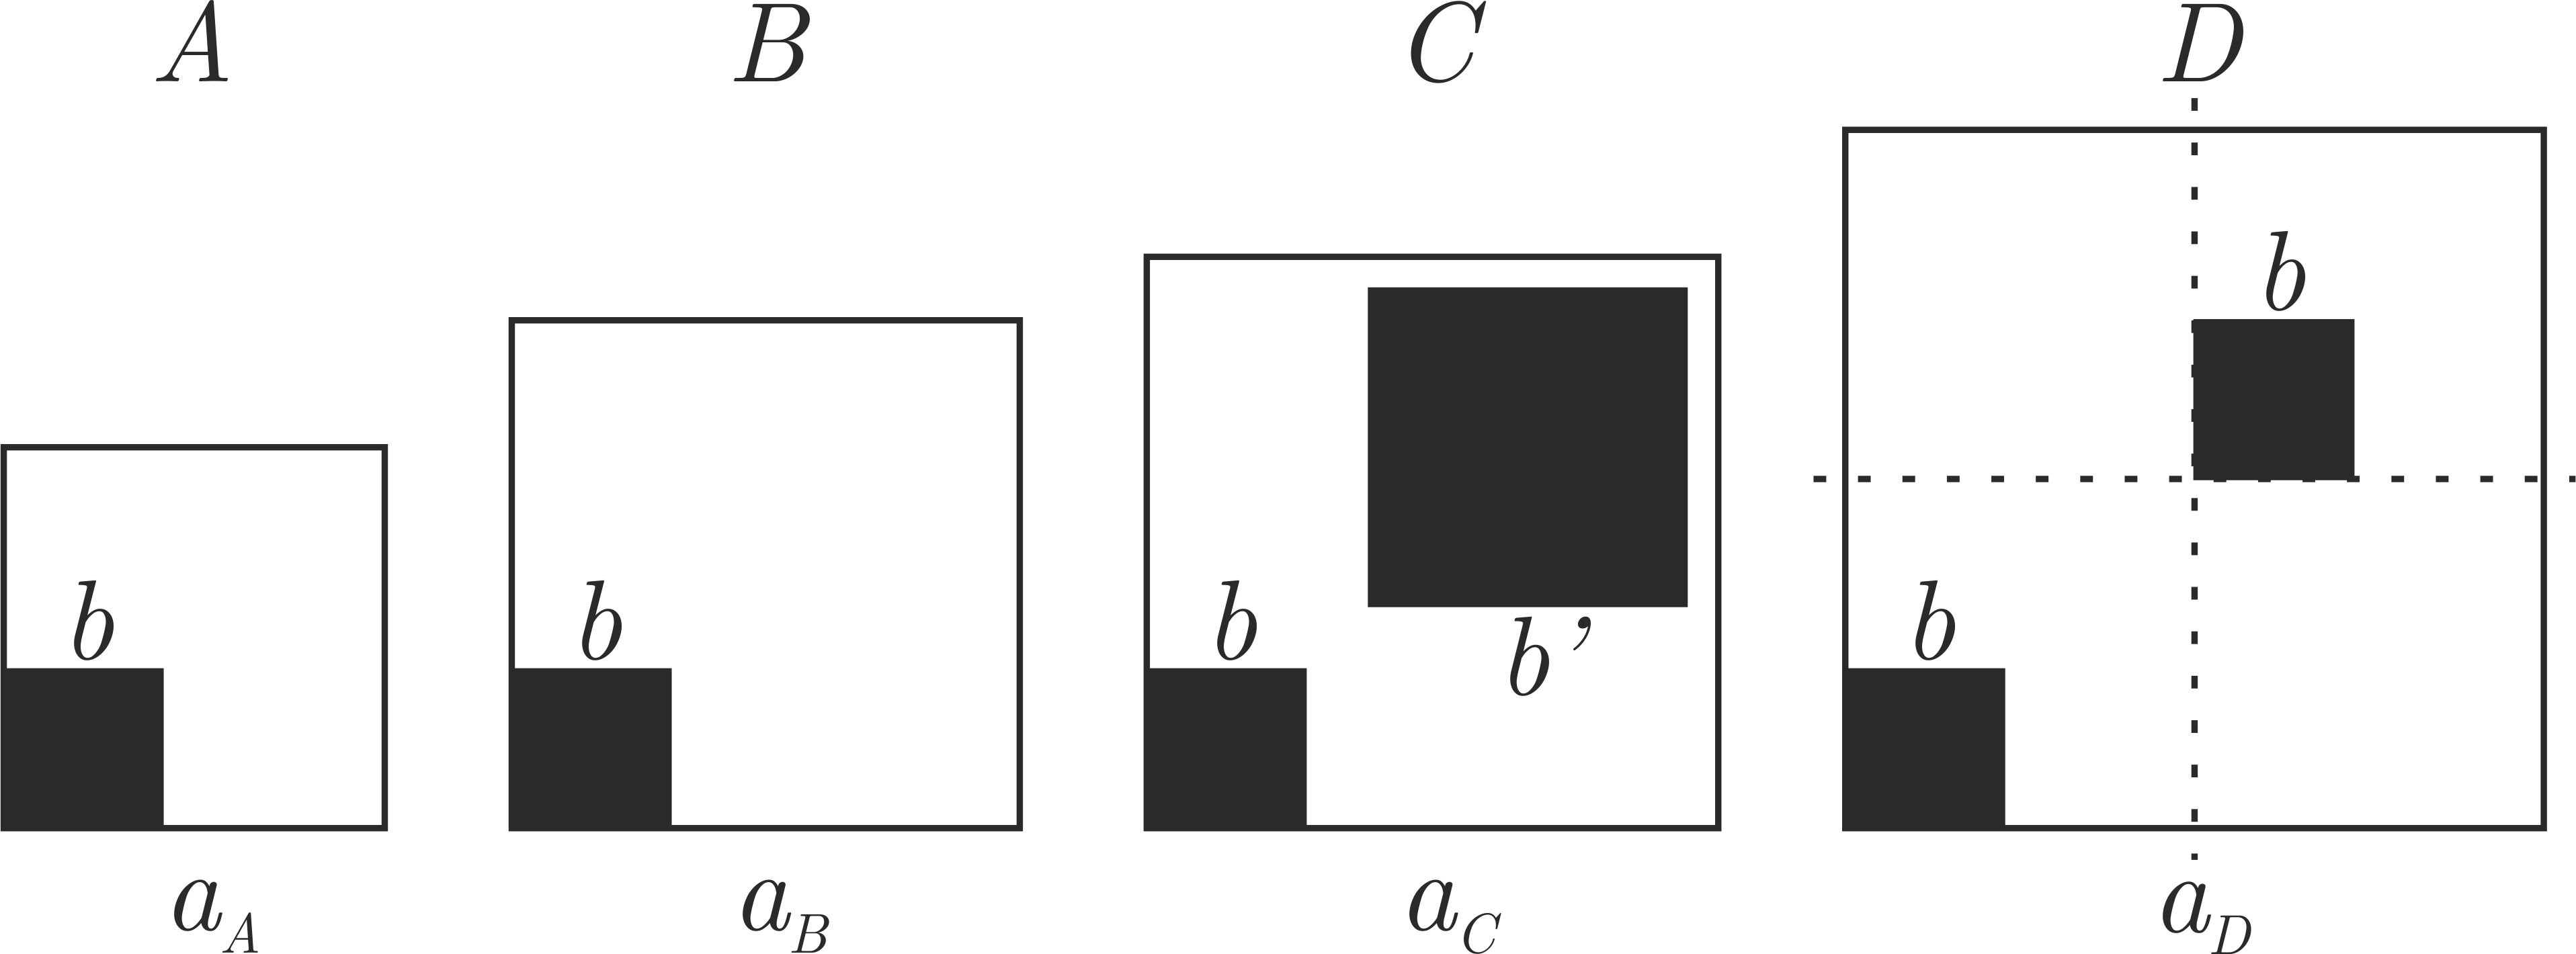
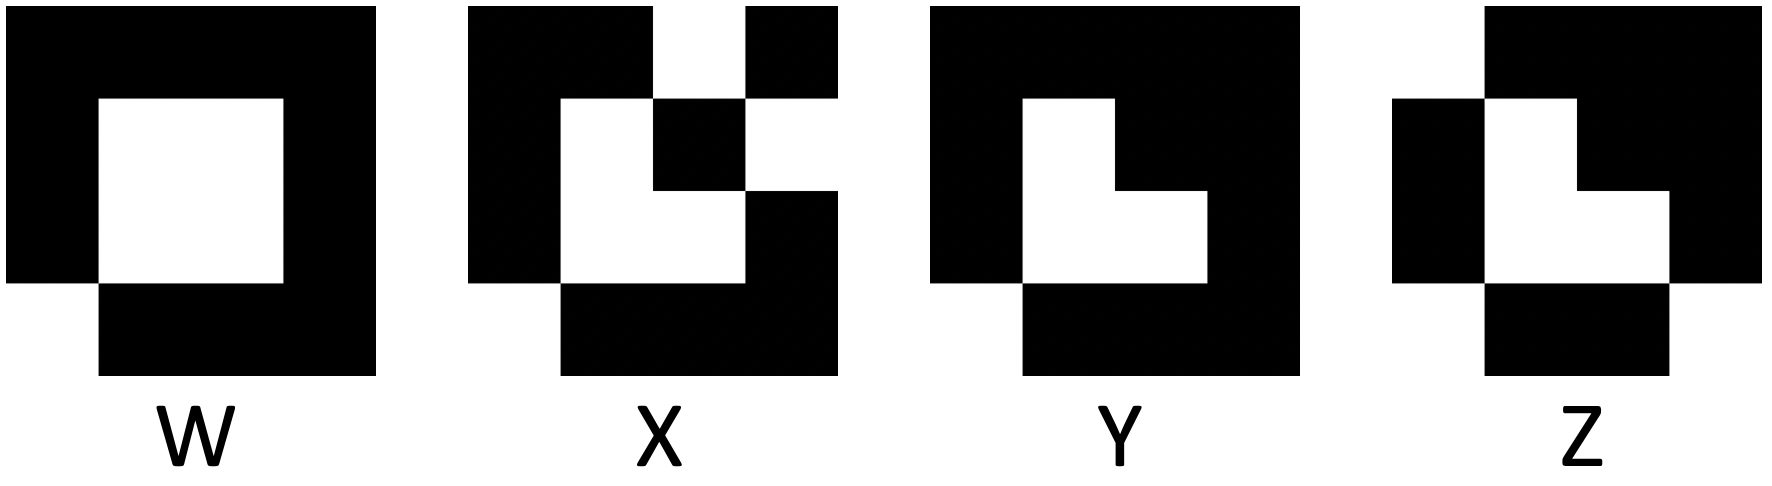
Consider four 2D crystals A, B, C, D (Fig. 6). These crystals have a square unit cell with perpendicular lattice vectors of equal length. The unit cell of each crystal contains an atom (a non-transparent square with a side $b$ on a transparent film). Unit cells C and D also contain displaced atoms of the second type. In crystal C, the size of an atom of the second type $ b'$ is larger than that of the first: $ b'> b $. In crystal D, the second atom is the same size as the first, and is displaced half a period to the right and half a period up.
B2 1.00 For crystals A and D, find the complex amplitude modulus $ | F (h, k) | $ for the reflex $ (h, k) $. Express your answer in terms of $ a $ (crystal period) and $ b $ (atom size). It is enough to indicate an expression that is true for all reflexes except for the central one ($ h = 0 $, $ k = 0 $)
The second step after calculating the parameters of the unit cell is to determine the symmetry of the unit cell.
The unit cells of real crystals often contain several molecules with some symmetry between them (Fig. 7). Knowing these symmetries greatly simplifies the process of defining the structure. The symmetry of the unit cell causes reciprocal symmetries and systematic absences (reflexes with zero intensity for each unit cell with this symmetry). Systematic absence is determined by special conditions for $ h $ and $ k $ (Fig. 8).
Typical Symmetries for Reflex Intensities:
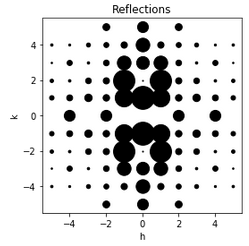
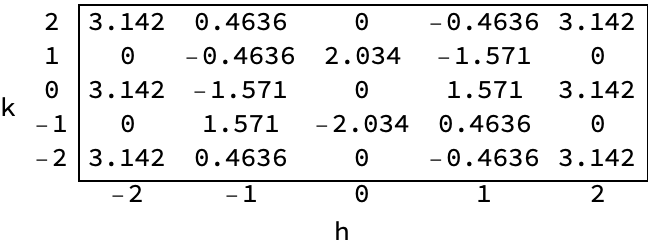
Consider a diffraction image (Fig. 9) from a 2D crystal with perpendicular lattice vectors equal to each other ($ a_1 = a_2 $). This diffraction image (only reflexes with $ | h |, | k | \le 2 $) is shown in the figure.
The axis of symmetry is – a straight line, which means it can be indicated as an equation of the straight line $ c_1 \cdot q_x + c_2 \cdot q_y = d, $ where $ c_1 $, $ c_2 $, $ d $ are some coefficients.
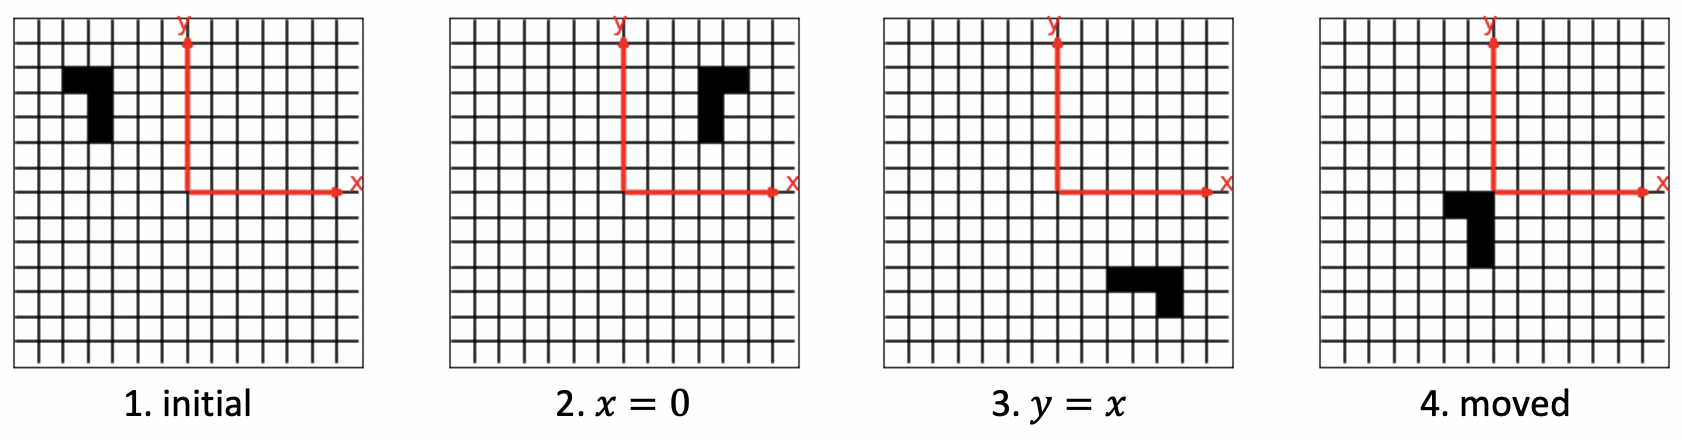
Let us consider some crystals with unit cells as in Fig. 10. Black squares represent non-transparent elements, white squares represent transparent elements. The unit cell of crystal 2 was obtained by mirror symmetry of the initial unit cell relative to the $ x = 0 $ axis. The unit cell of crystal 3 was obtained by the mirror symmetry of the initial unit cell about the $ y = x $ axis. Crystal 4 is obtained by shifting the original one by the vector ($ x_1 $, $ y_1 $).
The answer sheet contains unit cells for the patterns PG1-PG9. Having studied the symmetry of unit cells and diffraction patterns, and reflex absences, we will find a correspondence between them.
The symmetries of diffraction patterns can be calculated using the sum rule (the complex amplitude of a complex object is the sum of the complex amplitudes of the parts of that object) and knowledge of how the symmetries change the complex amplitudes of the terms. In addition, the sum rule allows you to define absences.
When you know the parameters of the unit cell and the symmetry of the unit cell, it is time for the last step - to determine the complete structure of the crystal.
When radiation is scattered by a crystal, the complex amplitudes can be calculated using the formula (the so-called Fourier transform)
$$F(\vec{q}) \sim \int \rho(\vec{x}) \cdot \exp (i \vec{q} \vec{x} ) d\vec{x}.$$
To determine the density of a crystal using a diffraction image, it is necessary to perform the inverse Fourier transform:
$$\rho(\vec{x}) \sim \int F(\vec{q}) \cdot \exp (-i \vec{q} \vec{x} ) d\vec{q}.$$
Since we have discrete reflexes, the above formula can be written as follows
$$\rho(\vec{x}) \sim \sum |F(\vec{q})| e^{i \varphi} \cdot \exp (-i \vec{q} \vec{x} ),$$
where summation is performed over all reflexes. In fact, it is enough to take only the brightest reflexes, since their contribution to the sum is the largest.
The experimentally measured intensities $ I (\vec{q}) $ make it possible to determine only the modulus $ | F (\vec{q}) | $. Unfortunately, the intensities do not contain information about the phases $ \varphi $, so it is impossible to directly calculate $ \rho (\vec{x}) $ from the intensities. This problem is called phase problem.
The usual way to solve the phase problem is to get some approximate phases, then calculate the density of the crystals using them, then update the phases using that density, and repeat this until you are satisfied with the resulting structure.
There are several methods for obtaining initial phases. One assumes that you already have a known crystal structure, and that the known and unknown crystals are structurally similar. In this case, you can simply use the phases calculated from the known structure with the measured intensities in the inverse Fourier transform (9) for the unknown structure.
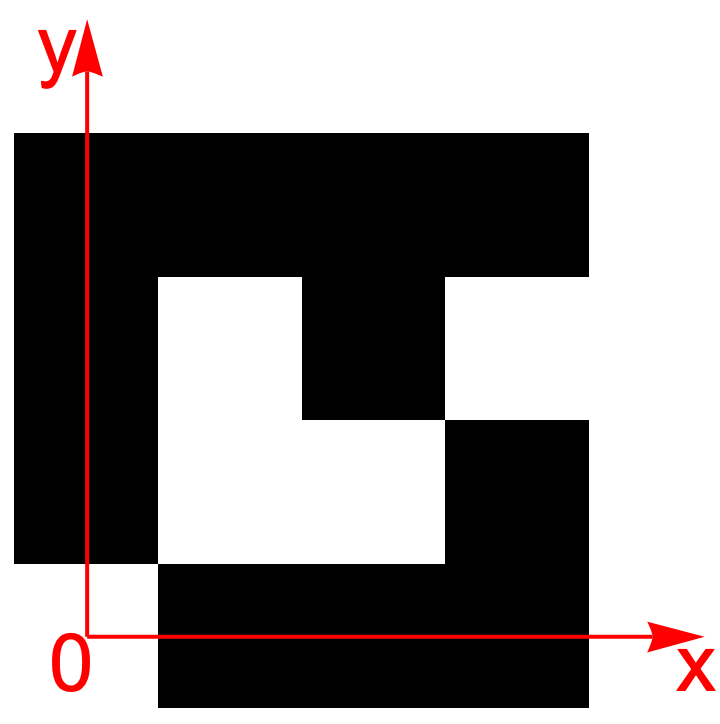
You have 3 different 2D crystals: MR0, MR1, MR2. The unit cell of each of them is a 4x4 square, with some squares non-transparent ($ \rho = 0 $), and others transparent ($ \rho = 1 $). The unit cell MR0 is known (Fig. 11). The structures MR1 (possible variants are shown in Fig. 12) and MR2 (contains 7 white squares) are unknown, but you know that they are quite similar to MR0.
Using the above approach, you will define the structures MR1 and MR2. Reflexes phases (in radians) with $ | h |, | k | \le 2 $ were preliminary calculated (Fig. 13) for the MR0 structure (in the coordinate system shown in Fig. 11). Hint: the imaginary parts of the densities $ \mathrm{Im} \rho(\vec{x}) $ vanish with good accuracy, which means that it is enough to take into account only the real part of each term (9).
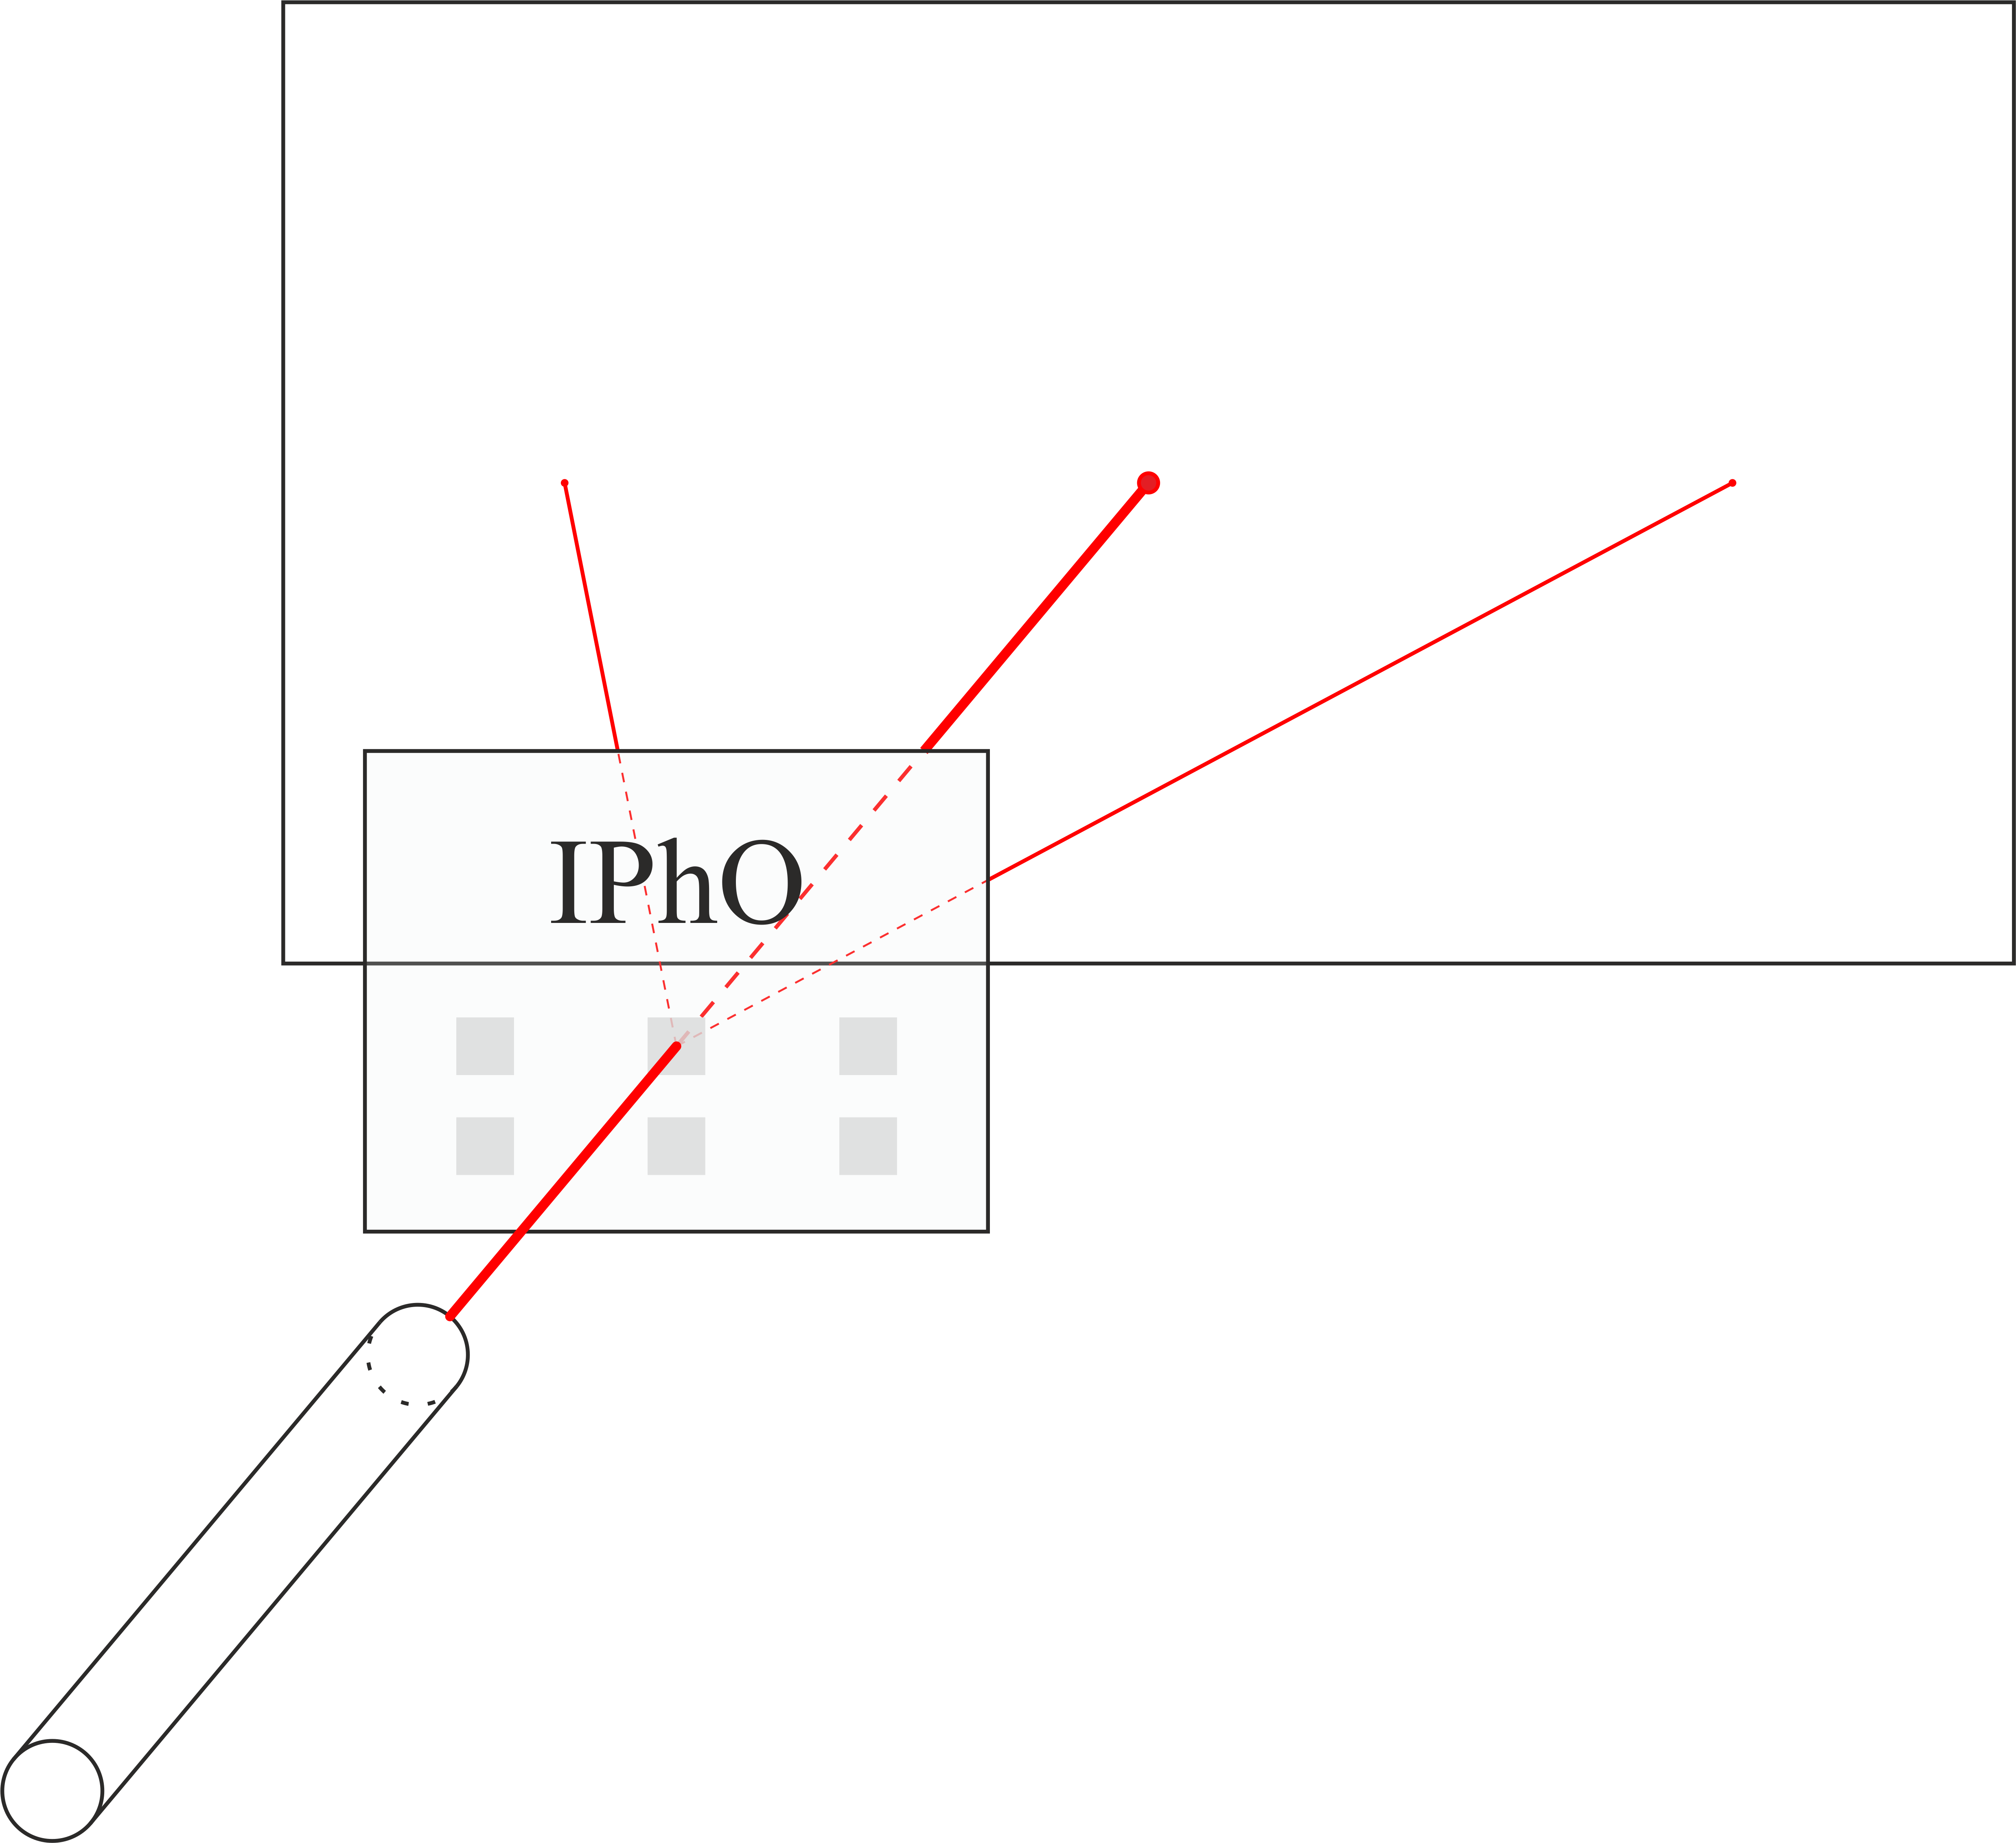
Samples should be illuminated with a laser as follows. Position the sample so that the caption (slide title in English) is on top of the slide and reads from left to right. In this case, the laser should be in front of the slide, and the screen for observing should be behind the slide (Fig. 15).
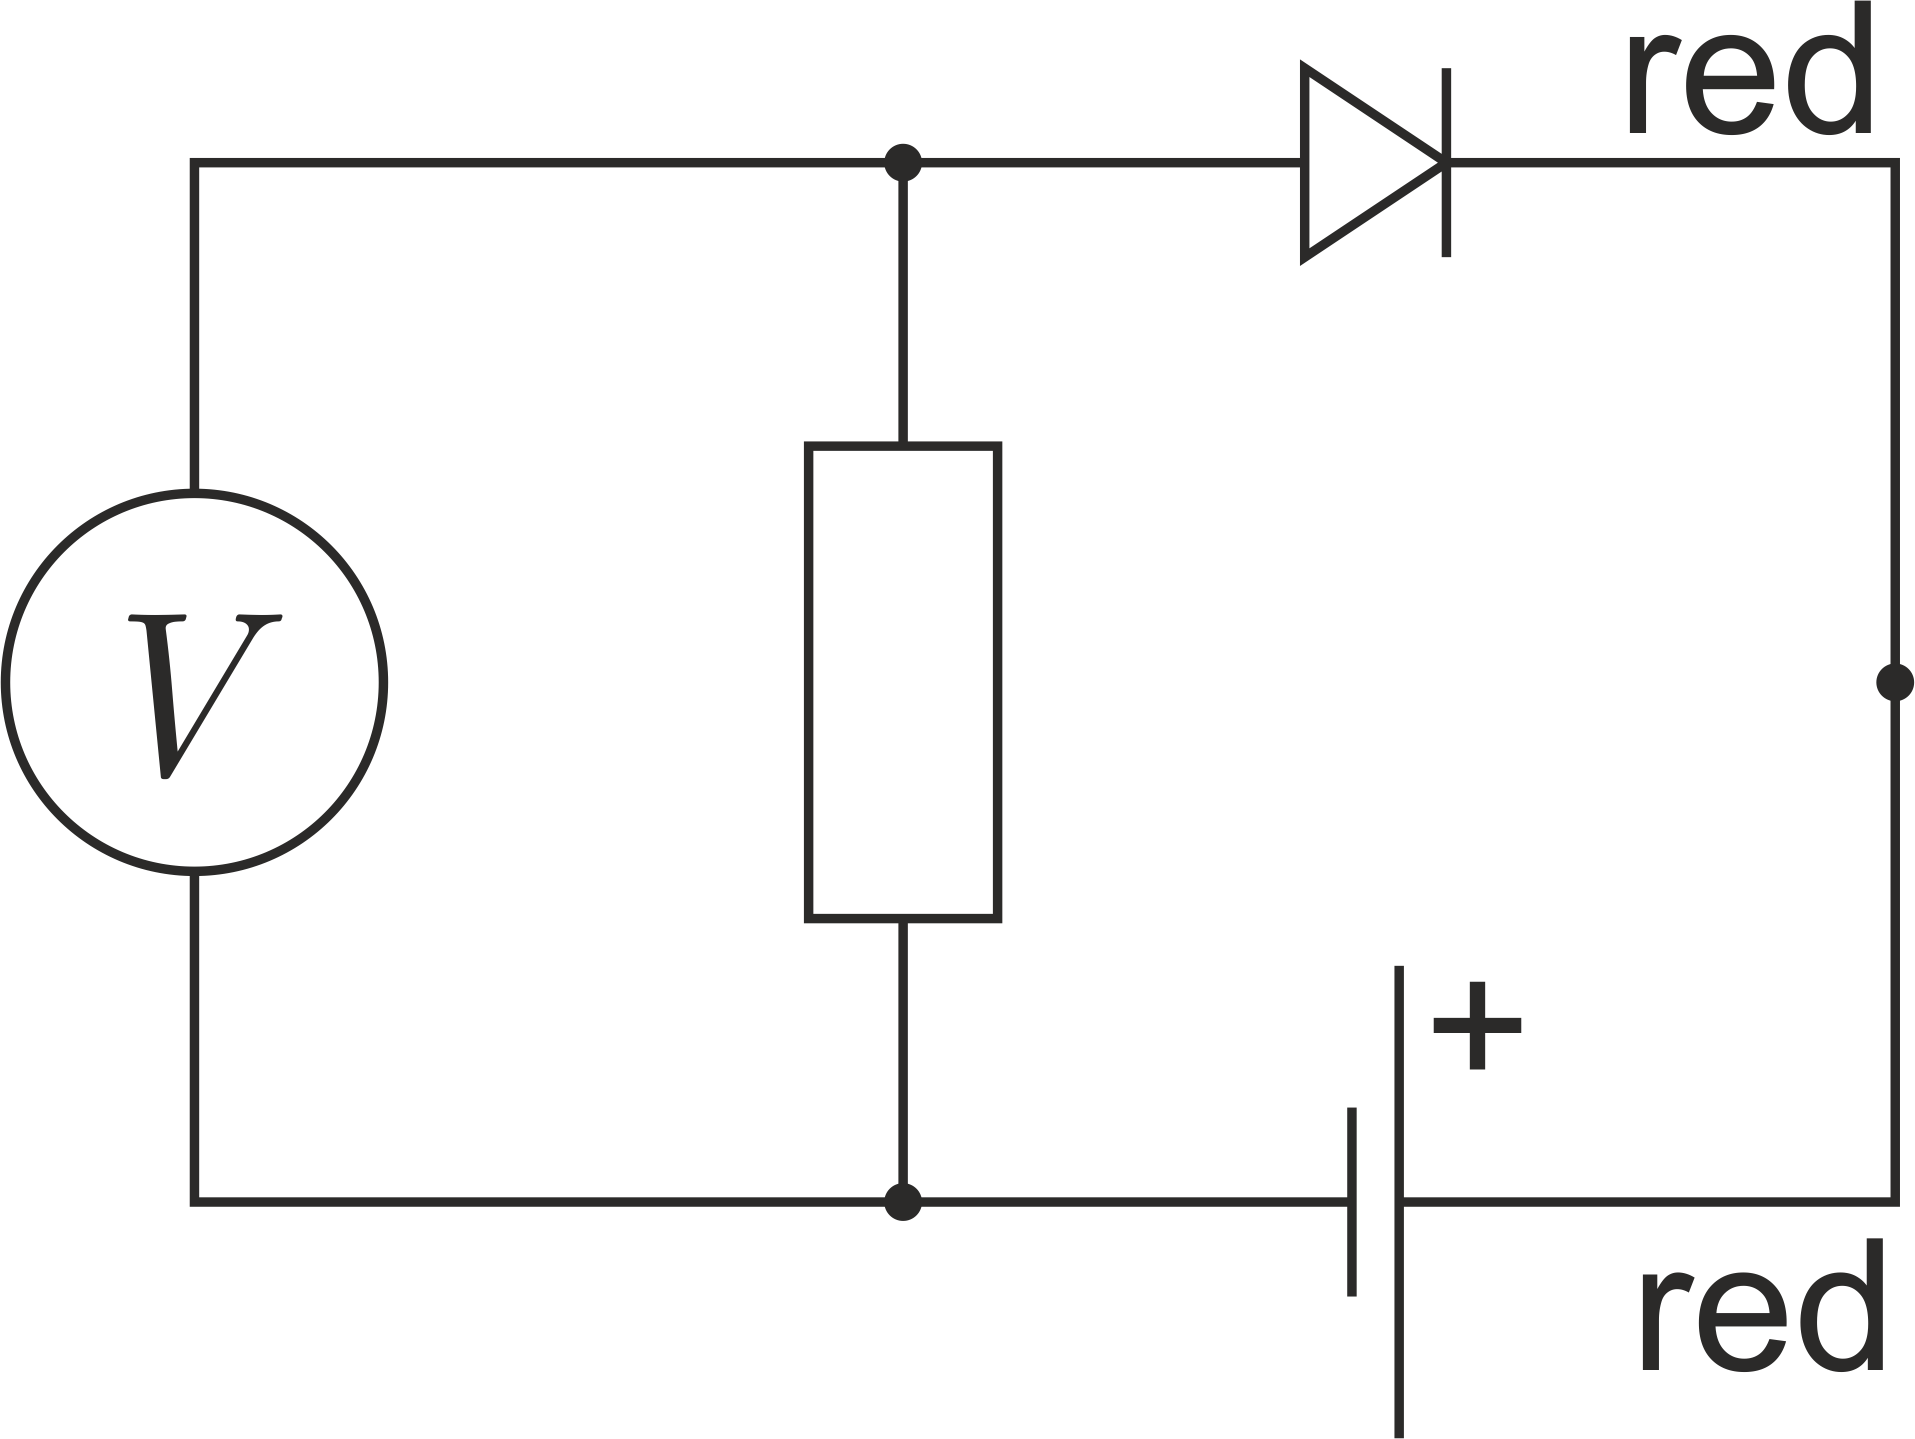
To measure intensities, use a photodiode connected to a voltmeter, resistor and battery according to the circuit shown in Fig. 17. In such a circuit, the current through the diode is proportional to the intensity of the incident light.
Pay attention to the polarity of the connection. On the battery block, the red wire is positive. By default, use a 10 kΩ resistor, in case the measured intensities are very small – use a 200 kΩ resistor.
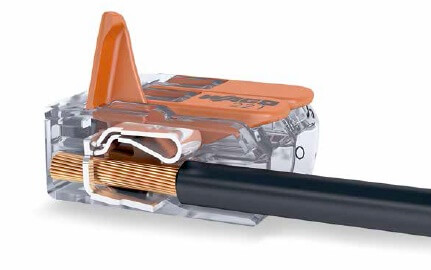
To use the connectors (fig. 18), do the following. Lift the lever up, insert the wire into the connector, lower the lever. All three connector points are electrically connected to each other.
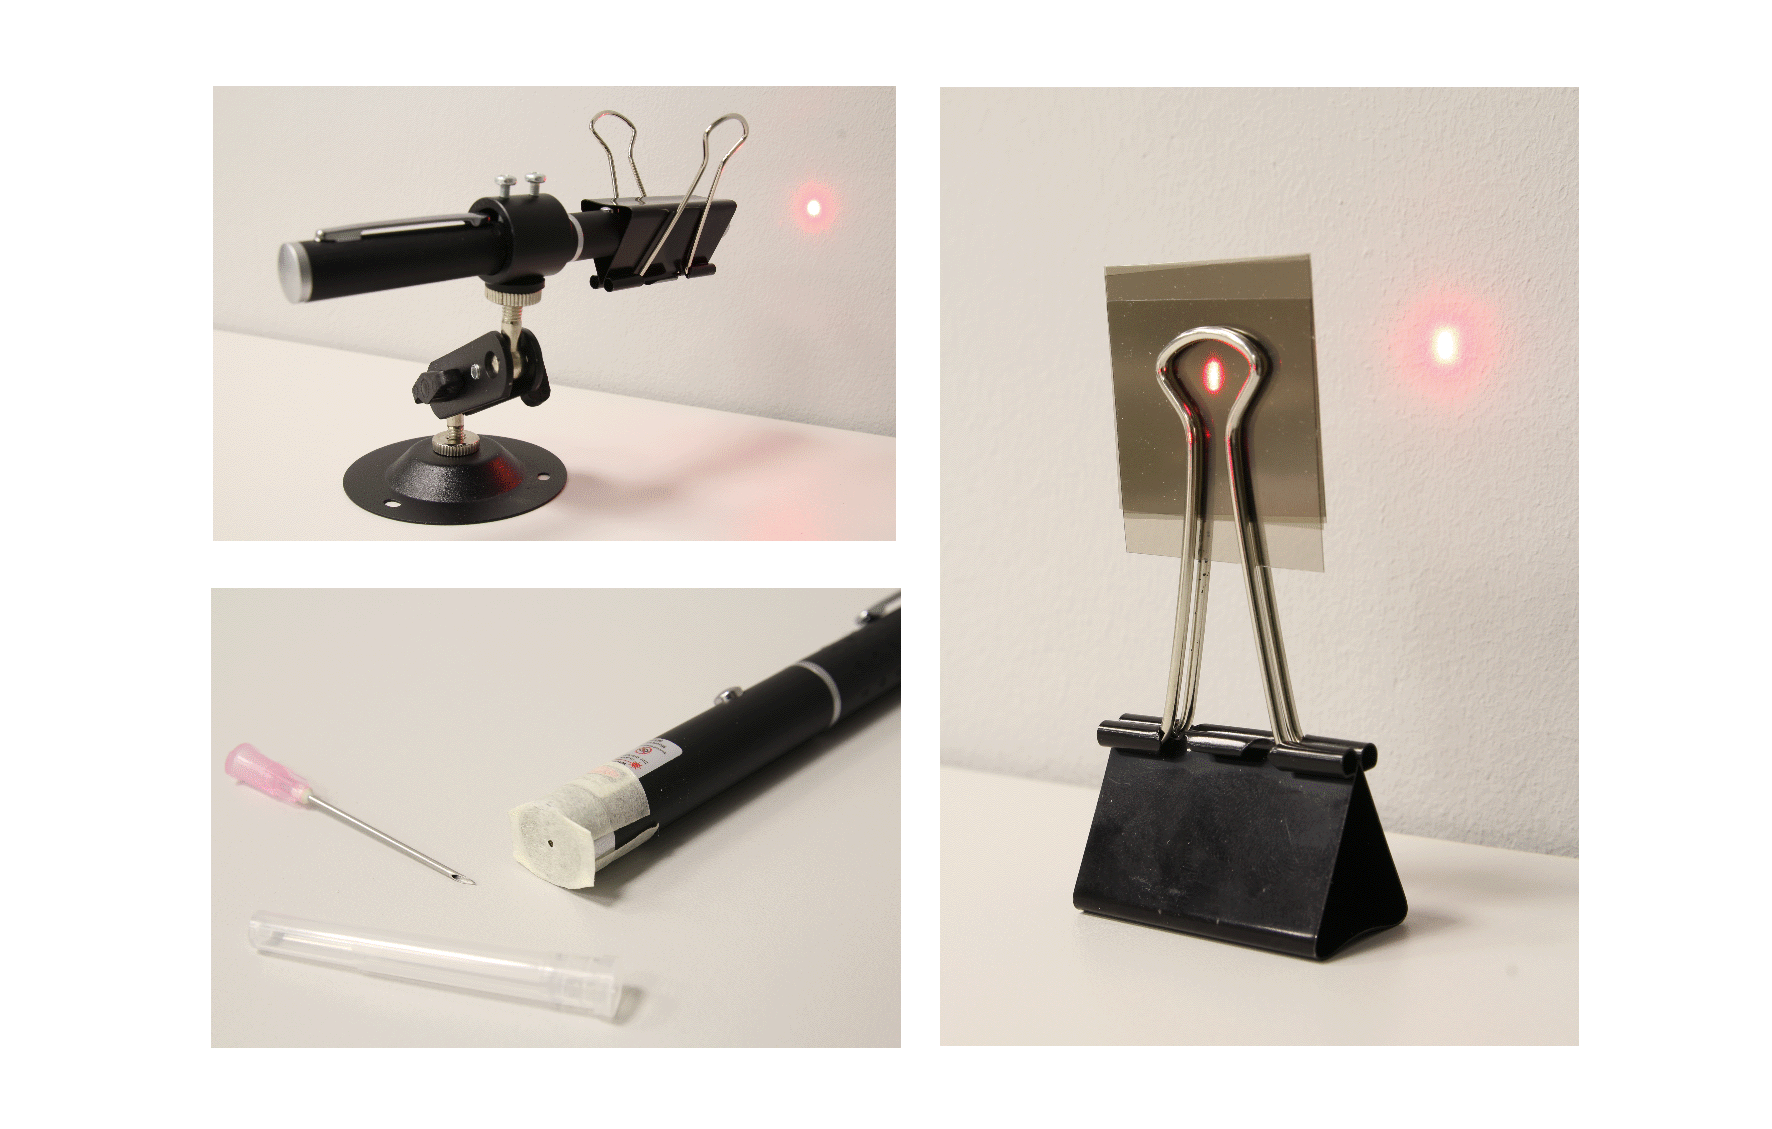
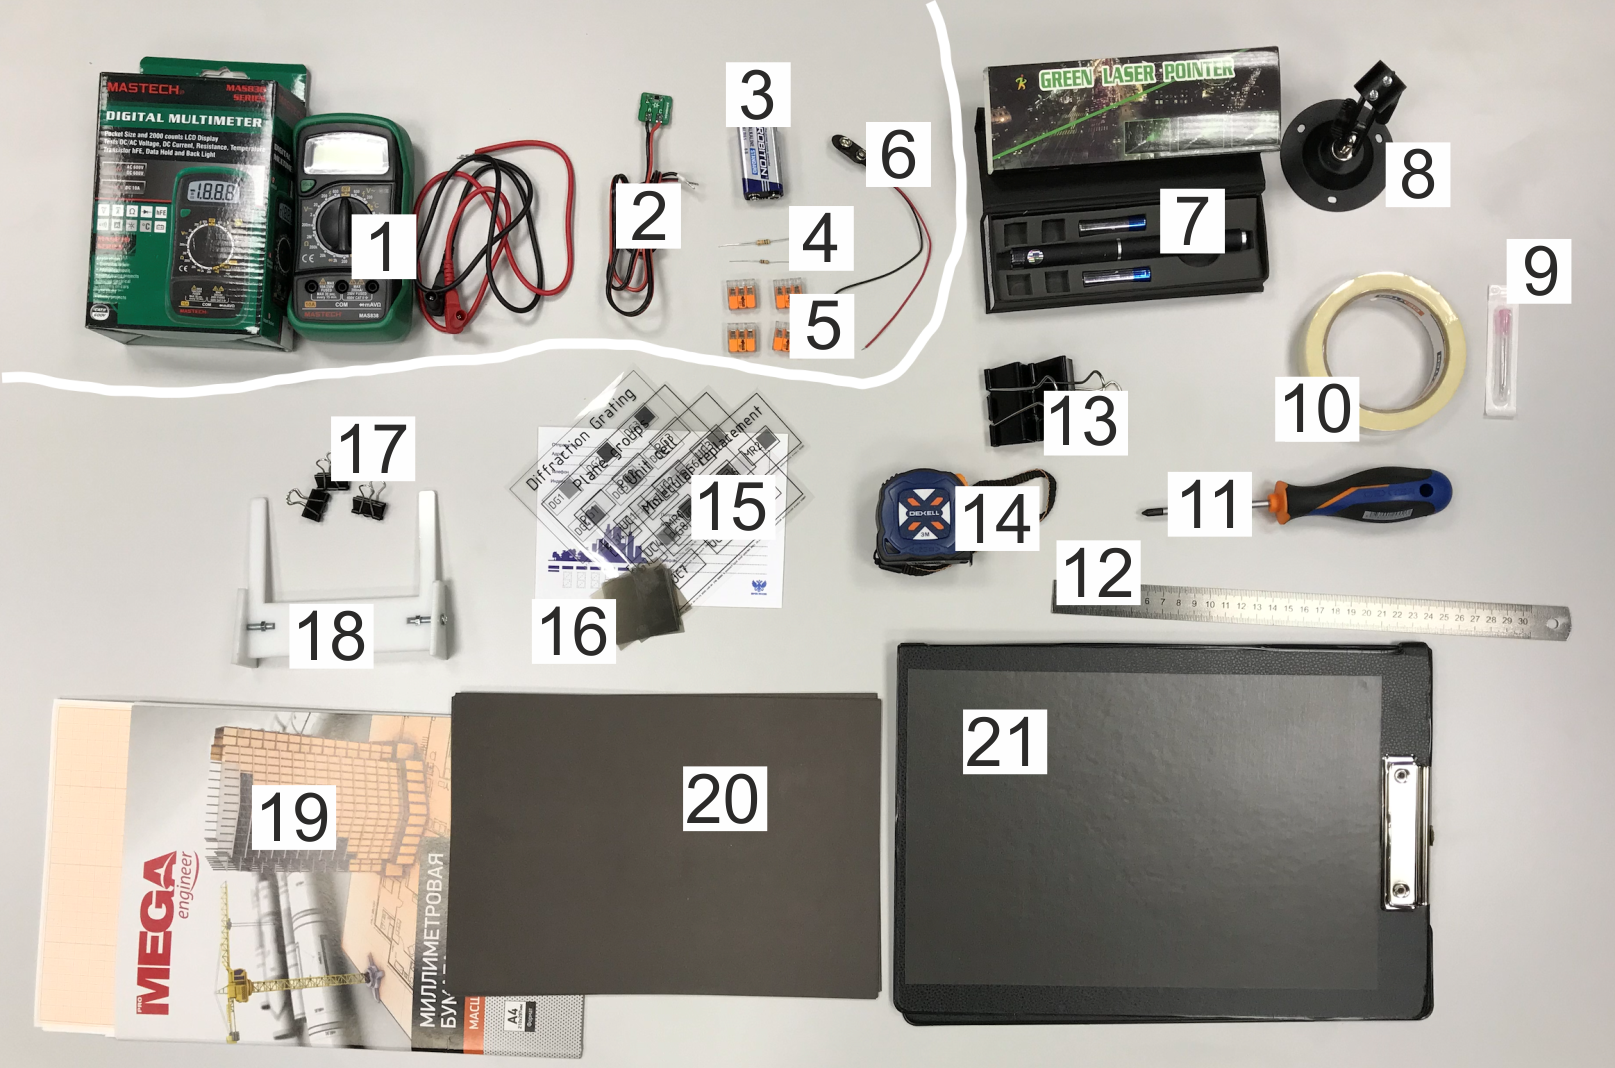
Mount the laser in the stand 8. Use a large clip to fix the laser on. If you need to make the laser beam narrower, then seal the laser hole with masking tape and make a hole in it with a needle. If you want to reduce the intensity of the laser – use a darkening film. Figure 19 is for your reference about that.
!WARNING! Direct exposure to the laser beam is hazardous to the eyes. Do not point the laser beam at yourself or other people. If you don't use the laser – turn it off.
!WARNING! A sharp needle is dangerous: you can get hurt! Use it carefully. When not in use, put the needle in the protective cover.